
I’m doing a trial of Kaseya 2008 hosted by the good folks at Virtual Administrator. I want to monitor my PBX in a Flash (PiaF) server, which runs under CentOS 5.2.
Although Kaseya doesn’t yet have a native Linux agent, it does allow monitoring of Linux boxes via SNMP. This article documents my first attempt at setting up basic Linux monitoring in Kaseya. This is new stuff for me so follow the example at your own risk!
Set Up SNMP on Linux
First, get your Linux machine ready to respond to external SNMP queries (mostly adapted from this article):
- Install SNMP and its utilities:
yum install net-snmp net-snmp-utils
- Use
snmpconfor manually update the/etc/snmp/snmpd.conffile. This can get very involved, but I found that I was able to use a fairly simple file:
rocommunity mycommunityname #read-only V1/V2 community

disk / 10%               # list / (root) disk

#includeAllDisks   10%   # list all disks
diskorincludeAllDisksentry if you want to be able to monitor disk statistics! (See here.) I only want to monitor the / (root) disk so I useddisk. - Start the SNMP daemon (snmpd) and set it to start automatically when Linux starts:
service snmpd start

chkconfig snmpd on
- Test dskPercent values by typing this command:
snmpwalk -v 1 localhost -c public .1.3.6.1.4.1.2021.9.1.9.1
- Test ssCPUIdle (percent) by typing this command:
snmpwalk -v 1 localhost -c public .1.3.6.1.4.1.2021.11.11
- Test memory statistics by typing this command:
snmpwalk -v 1 localhost -c public .1.3.6.1.4.1.2021.4
- Use WebMin to configure the Linux Firewall to accept inbound UDP connections on port 161. If your Linux machine is open to the Internet, lock this down to a specific subnet or even to the machine where the Kaseya agent is running. Remember to click on Apply Configuration to apply the changes!
What to Monitor
There are lots of nodes in UCD SNMP MIB for performance monitoring, as you can see in this reference. I just wanted to monitor the basics (disk space, CPU, and memory), so here is what I chose to use:
- dskPercent indicates percent in use. I only want the / (root) disk, which in the SNMP tree ends in .1 on my machine.
- ssCPUIdle is deprecated, but it’s exactly what I want: average CPU percent idle in the past minute. The “new” way is to use ssCPURawIdle, but that returns ticks per CPU, which means you have to calculate the percentage (here’s how), and the calculation may differ on different machines.
- It’s no easy feat to calculate Linux memory usage. Besides the SNMP results, you can try the
freeandcat /proc/meminfocommands to see how memory is allocated. My understanding is that “free” memory is made up of memAvailReal + memBuffer + memCached (buffer and cached are used by the operating system but could be allocated to programs if necessary). Divide that total by memTotalReal and you would have percent free. Update 02/14/2011: at least on CentOS, memTotalFree is the sum of memAvailReal + memAvailSwap and seems like a more commonly-used basis for determining available memory (cf. this article).
Set Up Kaseya
Finally, set up the SNMP monitoring set in Kaseya. These are the steps to do that from scratch. If you want to start from the simple SNMP Set that I created, you can download it from the bottom of this article, import it into Kaseya, and pick up at step 8.
- Make sure Kaseya can see your newly configured Linux machine as an SNMP device. Go to Monitor > SNMP Monitoring > LAN Watch and schedule a scan from one of your servers with Enable SNMP checked. Used the community name you specified in step 2 above. Work on the following while the scan runs.
- Go to Monitor > Edit > SNMP Sets > Edit an existing SNMP set (or Add a new one).
- Click Add to add your first MIB object. If the object you want to monitor isn’t listed, you’ll need to import into Kaseya the UCD-SNMP-MIB mib file (available near the bottom of this page): click Add Object then follow the screen instructions to Load MIB, Add MIB Objects that you’ll use, then Remove MIB. Add the following objects:
- dskTable.dskEntry.dskPercent
- systemStats.ssCpuIdle
- memory.memAvailReal
- memory.memBuffer
- memory.memCached
Note: this is the way it is supposed to work, but for some reason, I was not able to add the MIB objects from the MIB tree. It may be that I don’t have permission to update the object list. A fairly easy workaround was to directly edit the XML for an existing SNMP set, adding in the objects I want to use, then to import that SNMP set.
- Back in the main SNMP Monitor Sets window, add the monitor on dskPercent. Alarm if over 80% for five minutes.
- Add a monitor on ssCPUIdle. Alarm if under 10% for five minutes.
- Memory monitoring isn’t as straightforward. Unfortunately Kaseya doesn’t allow calculations on counters, so we’ll have to monitor memAvailReal, memBuffer, memCached, and memTotalReal. They will appear in the monitor logs. For an alarm, it looks like Linux generally keeps 10% – 20% of memory completely free (memAvailReal), so I’ll try an alarm on memAvailReal going below about 5% of memTotalReal. On a system with 512MB, that means below about 26,000KB. I won’t set an alarm on the other counters (i.e. set to alarm if Under 0).
- Save your SNMP set.
- Hopefully the scan from step 1 has completed by now. Go to Monitor > SNMP Monitoring > Assign SNMP and click on the name of the server for which you ran the scan. You should see the Linux box in the list of devices. Assign the SNMP set you just defined to that device.
- Monitor > SNMP Monitoring > SNMP Log to make sure data is coming in from your Linux device based on your SNMP set.
You may also want to set up a System Check to ping your Linux box. This can alert you if the entire machine goes down. Remember to open your Linux Firewall to accept ICMP echo-request packets if you haven’t already. I covered how to do this in Setting Up PBX in a Flash, Part 2: Before Running FreePBX, near the bottom, in the paragraph beginning “Update 10/12/2008.”
MCB-Linux SNMP Monitors.xml (10.08 kb)
Update: Performance Implications
05/01/2009: Ironically, performance monitoring always has a performance cost, and Kaseya’s approach to Linux monitoring is no exception. Kaseya “pings” the Linux server with each monitor every 30-40 seconds. The Linux SNMP agent, by default, logs two lines for each ping. In spite of this, /var/logs/messages, set up for weekly rotation, only reached about 85MB before rotating. This article and this manual page helped me figure out that I could turn off this logging by adding this line to /etc/sysconfig/snmpd.options:
OPTIONS="-LS4d -Lf /dev/null -p /var/run/snmpd.pid -a"
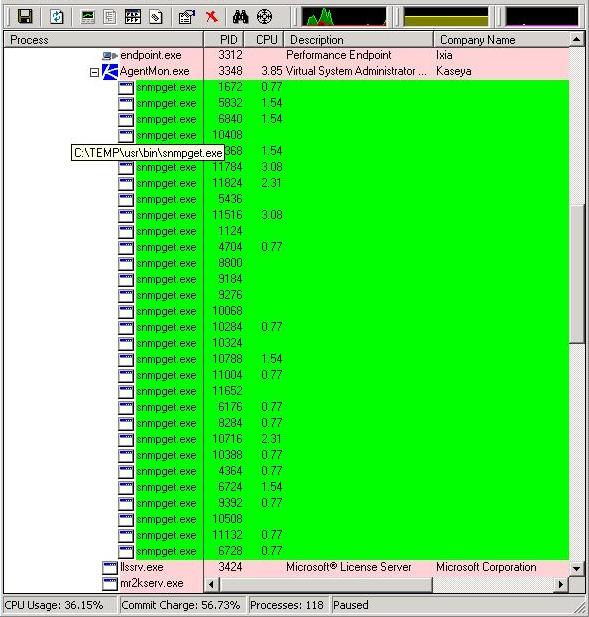
Perhaps the greater concern is on the Windows server side, where the Kaseya agent is running. This took some digging to understand. This post has a long comment by a Kaseya engineer dated 11/27/2008. Near the bottom of that comment, we learn that the by default, Kaseya launches up to 50 (!) snmpget threads at a time. I don’t even have that many monitors, but I was able to confirm that it launched 30 threads at once, as seen here in green in Process Explorer:
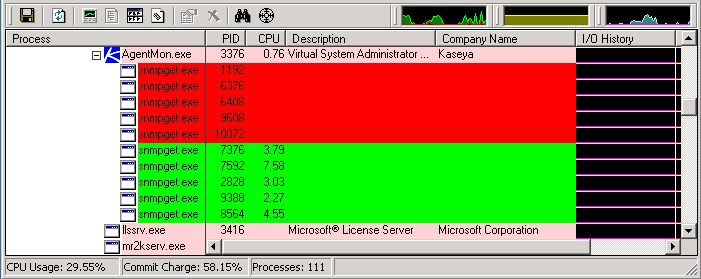
Fortunately, Kaseya offers a workaround, and Virtual Administrator was kind enough to implement it. In the SQL for my server, they set maxSNMPthreads=5. Sure enough, that cuts down dramatically on the number of processes. Rather than run 30 threads at once, Kaseya runs the snmpgets in batches of 5. This is evident in this image, where 5 processes are exiting and 5 more are starting:
For further discussion of Linux monitoring, check out this MSPMentor article, which cites the original post above.
Hello Mark!
Did you by any chance kept using this solution? Did Kaseya have issues to recognize that a given linux box was running SNMP? Here I’m scanning for my Linux boxes and it can’t find them.
Sorry Tiago, I haven’t used Kaseya in a couple years. However off the top of my head, I would check the firewalls on the Linux boxes (step 7 at the top of this article). I would also allow ICMP in case Kaseya is using PING to look for the Linux boxes–this is described above in the paragraph beginning, “You may also want to set up a System Check to ping your Linux box.”